Overview
Q-Lens brings conversational, on-demand analysis to your operational data.
When exploring your operational data, one question naturally leads to another. Q-Lens is designed for exactly that workflow: interactive exploration, rapid iteration, and actionable insight.
With Q-Lens, you can ask questions in plain English and instantly receive answers, along with the underlying logic, queries, and visualizations, to support decisions and actions.
Availability
Q-Lens is available starting with Quantivly Platform version 2.6.4 and above
What is Q-Lens?
Q-Lens uses generative AI to interpret natural-language questions, identify relevant data, and generate analyses, visualizations, and explanations to support operational decision-making.
It is specifically tailored to the metrics, concepts, and relationships defined in Quantivly’s ontology. This grounding allows it to reason about your operational data in a structured, consistent way, rather than relying on generic analytics or free-form interpretation.

Responsible Use
Like any generative AI–based functionality, Q-Lens may occasionally misinterpret a request or produce incomplete results.
For best results, we encourage users to treat Q-Lens as an interactive analytical assistant: refine questions as needed, review the reasoning steps it provides, and use its outputs as a starting point for deeper exploration and decision-making.
Q-Lens is designed to support operational analysis and should always be used alongside professional expertise and appropriate validation, especially for critical workflows. It is not a substitute for human review or verification.
Data Processing & Privacy
Q-Lens uses Large Language Models (LLMs) to interpret natural-language questions and generate analytical logic, including SQL queries and Python code.
Under the hood, Q-Lens is more than a simple interface or wrapper around an LLM. It includes a dedicated intelligence and orchestration layer designed to understand the concepts, metrics, and relationships defined in Quantivly’s ontology. This layer grounds user questions in operational context, maps them to the appropriate data, and coordinates the analytical and visualization steps required to produce an answer.
All orchestration and execution occur on-premise, within your Quantivly deployment. While an external LLM may be used to translate user requests into SQL and Python code, all generated queries and code are executed locally under Quantivly’s control.
Q-Lens does not use a traditional Retrieval-Augmented Generation (RAG) architecture, where a model dynamically retrieves and injects external content at runtime. Instead, Q-Lens relies on a controlled on-premise orchestration layer that ensures analytical execution remains grounded in your operational data and governed environment.
LLMs never execute code directly against your databases or systems, and they do not have direct access to your data stores. All data processing, query execution, and result generation remain within your on-premise environment and are subject to the same security controls, access restrictions, and auditing mechanisms as the rest of the Quantivly platform.
Accessing Q-Lens
Q-Lens can be accessed directly from the side navigation panel in the Quantivly platform. This will launch an interactive workspace where you can ask questions, explore results, and generate analyses and visualizations.

Prompts to get you started
You can ask a wide range of questions in Q-Lens, from high-level operational patterns to detailed workflow investigations. The best way to use it is to just dive in.
If you are getting started, the examples below illustrate the types of analyses Q-Lens can help with:
Scanner compliance and execution
“Which exams were performed on a different scanner than the one originally scheduled during summer 2025? Can you include supporting plots?”Slot utilization and efficiency
“Which protocols consistently do not use the full appointment slot duration?”Daily imaging patterns by patient type
“How do imaging volumes differ across emergency, inpatient, and outpatient populations during a typical day?”Scanner usage segmentation
“Are certain scanners used primarily for outpatient imaging versus inpatient imaging?”Equipment and coil utilization
“Which coils were most used during summer 2025 for MR imaging? Can you generate a heatmap of coil usage by scanner?”
Tip
For best results, specify the time period and modality you want to analyze (e.g., MR in summer 2025).If no timeframe is provided, Q-Lens will default to analyzing the most recent 6 months of available data.
Q-Lens’ thinking steps
Q-Lens makes its analytical process transparent by showing the key steps it takes to answer each question.
For every request, Q-Lens will:
Confirm its interpretation of what you are asking

Generate the analytical steps needed to respond
Execute queries and computations within your Quantivly environment
Present results as explanations, tables, and visualizations
.png)
Data Visualization
Q-Lens can generate a wide range of visualizations to support operational analysis—simply describe what you would like to see.
Examples include:
Bar charts |
|
Heatmaps |
|
Line charts |
|
Box plots |
|
Violin charts |
|
.png)
.png)
.png)

.png)
Downloading & Exporting
Q-Lens makes it easy to reuse results outside the platform:
Each visualization can be downloaded as a PNG file or copied directly into documents and presentations
Query outputs and tabular results can be exported as CSV files for further analysis or reporting
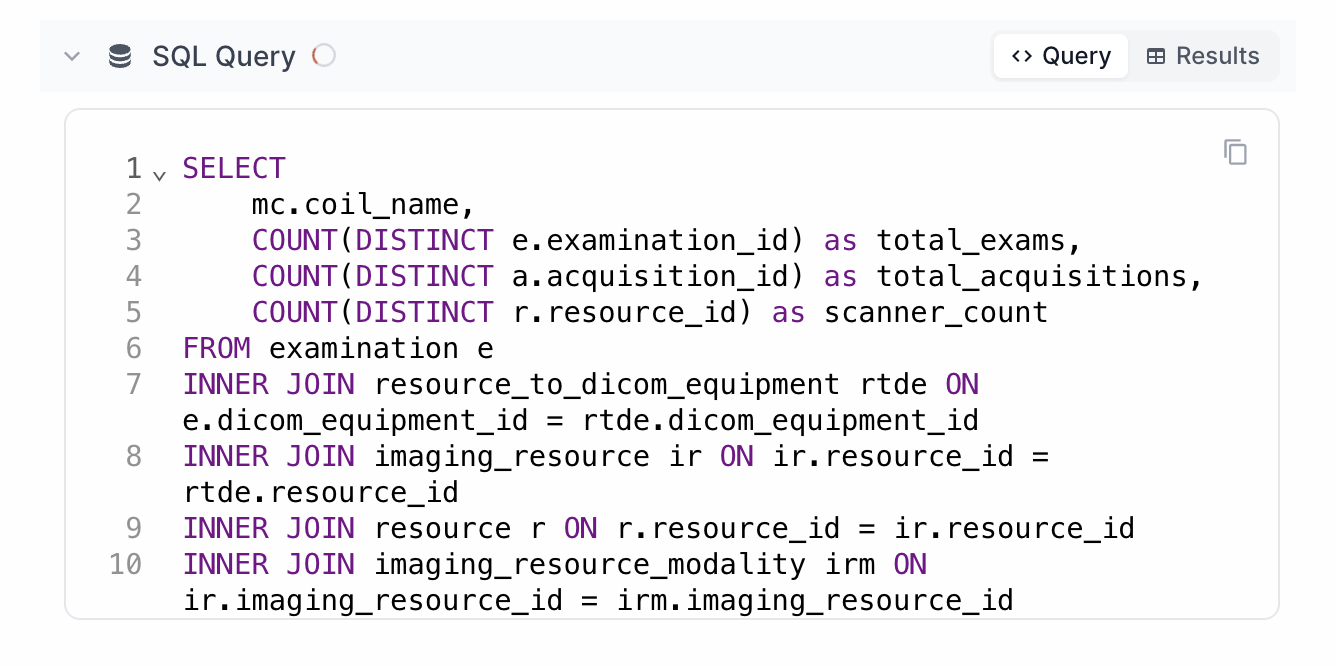
The underlying SQL queries and Python code generated by Q-Lens can also be copied and reused in your own analytical workflows
.png)
Sharing Feedback
Your feedback helps improve Q-Lens over time.
If you encounter unclear results, unexpected interpretations, or have suggestions for improvement, please share feedback through your Quantivly support channel or directly with your Quantivly representative.
FAQ
Can I save or revisit past conversations?
Not yet, but this feature is coming soon!
Does Q-Lens support other languages?
At this time, Q-Lens primarily supports English. Additional language support may be added over time depending on customer needs and deployment requirements.
How quickly does Q-Lens reflect new or updated data?
Q-Lens always operates on the data currently available within your Quantivly environment. New operational changes will be reflected as soon as they are ingested and available in the platform’s analytics layer.
How accurate are Q-Lens answers?
Q-Lens is designed to be highly useful for exploration and operational decision support, but like any AI-assisted tool, it may occasionally misinterpret a request or produce incomplete results. Q-Lens helps users validate outputs by showing the reasoning steps, queries, and code behind each answer. For critical workflows, results should always be reviewed and confirmed using professional expertise.
Is there a timeout or limit on requests?
Q-Lens is designed for interactive analysis. Response times depend on the complexity of the question and the volume of data being analyzed. If a query requires significant computation, Q-Lens may take longer to respond or suggest narrowing the scope.
Which LLM does Q-Lens use?
Q-Lens is model-agnostic by design. The underlying LLM can be changed or upgraded without affecting the user experience or the surrounding analytical logic. At present, Q-Lens uses an LLM provided by Anthropic, though this choice may evolve over time as models and capabilities advance.
Can Q-Lens access or modify my data?
No. Q-Lens has read-only access to the database and cannot modify the underlying data.
Is Q-Lens a Retrieval-Augmented Generation (RAG) system?
No. Q-Lens does not rely on a traditional Retrieval-Augmented Generation (RAG) architecture where models dynamically retrieve and inject external content. Instead, Q-Lens uses a controlled on-premise orchestration layer to ensure analytical execution remains governed, local, and grounded in your operational data.