Inspect the timeline of your imaging operations, scanner by scanner, to compare what was scheduled vs what happened.
This feature is in beta - we have planned improvements over the coming weeks, to bring some of your favorite features from our Modality Metrics and Daily Overview dashboards, all in one place. In the meantime, we welcome your feedback to improve it and make it more useful to you. Please see below to reach out and chat with us.
Note : the Calendar was formerly accessible as the Schedule Explorer
Getting started
The Calendar is directly accessible from the side navigation menu.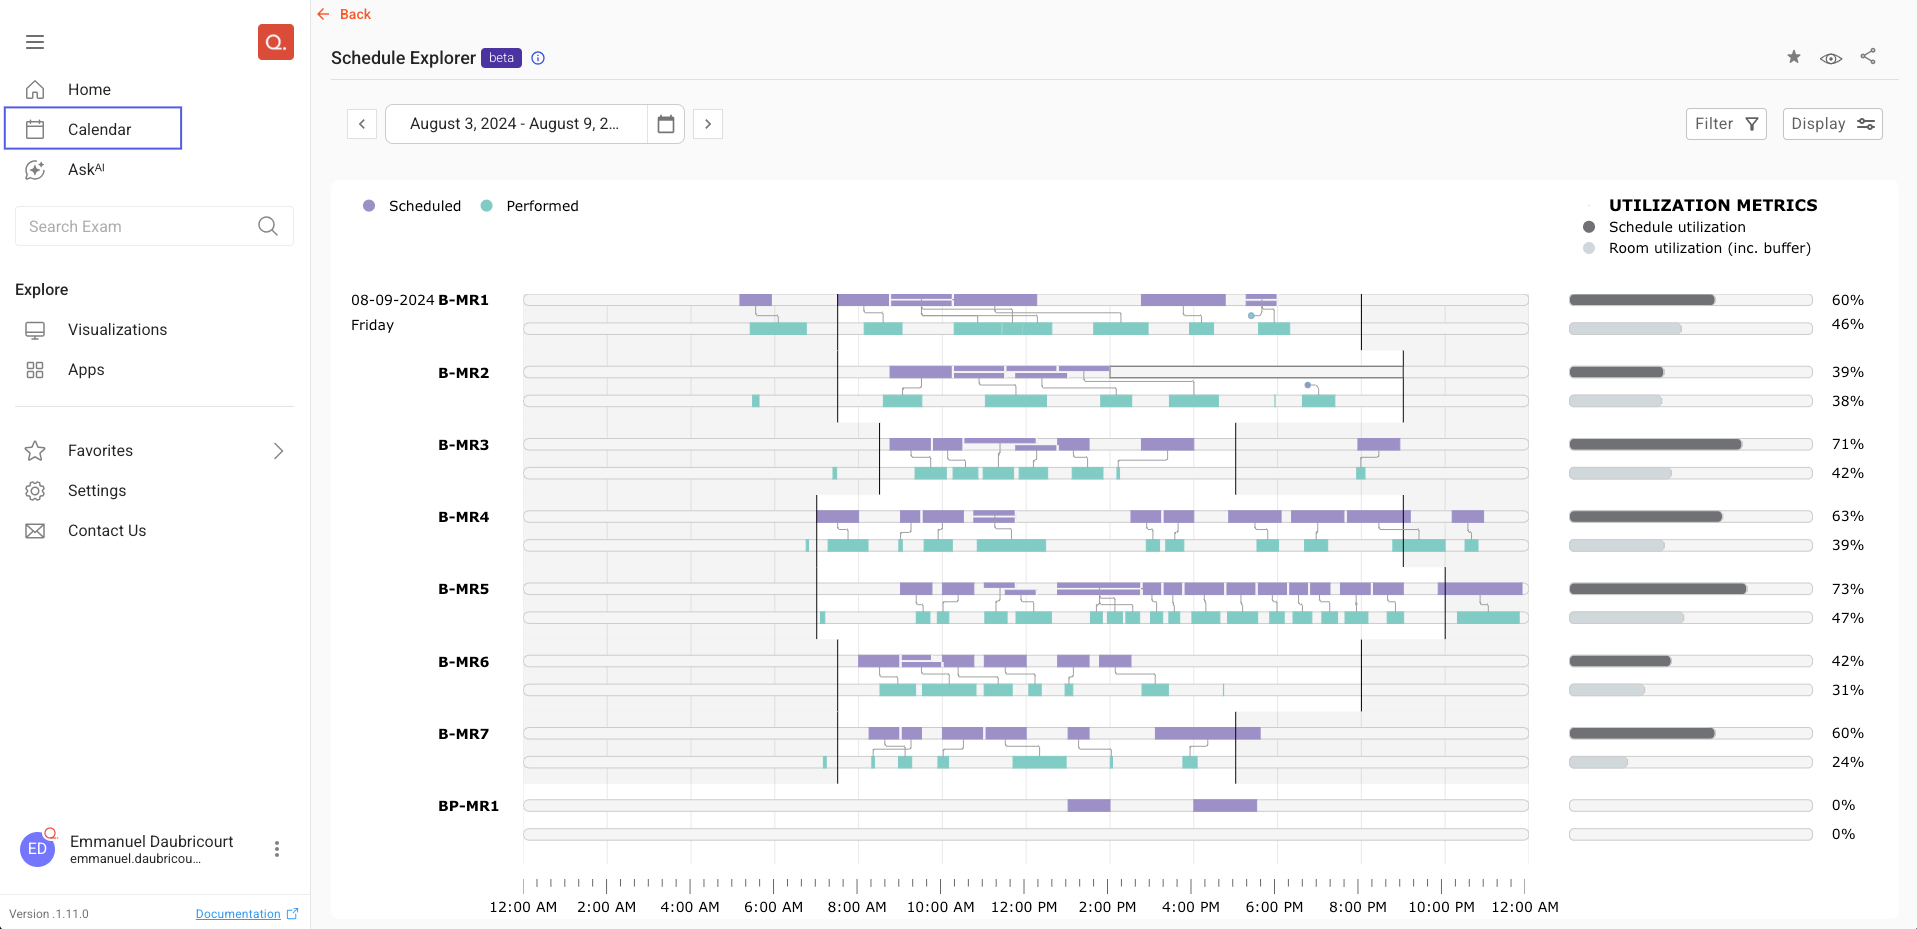
Understanding the data
The Calendar is a visualization of how long your imaging operations unfolded throughout the day. It combines DICOM and HL7 data into a harmonized view.
From the ‘Display’ button, you can select different modes.

Visualization modes
‘Scheduled vs Performed’ Mode | By default, that is the mode will be displayed: it shows a comparison of appointments (what was scheduled) and exams (what was performed), for each scanner and each day within your selection. In this mode, you will be able to visualize links between appointments and exams that are linked.
Note that a Buffer time is added to 'performed' tiles, to account for patient change time. It appears in a lighter green. |
‘Scheduled’ Mode | In this mode, only appointments are displayed. |
‘Performed’ Mode | In this mode, only exams are displayed. Note that a Buffer time is added. Both 'Scheduled vs Performed' and 'Scheduled' require integration with HL7 to be displayed. |


Operating Hours
Operating Hours are represented with a light grey overlay. They are taken into consideration in calculation of numerous metrics - please keep reading for more details and don’t forget to take a look at our glossary.
Buffer time & How it affects the Calendar
About buffer time
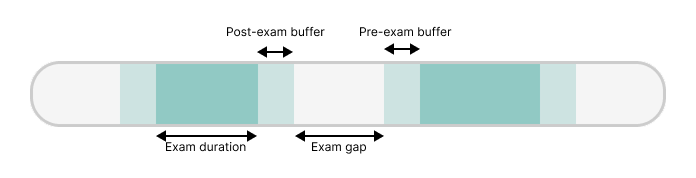
Buffer time allows you to model the time spent preparing the scanner for patients (pre-exam buffer) and the time it takes for patients to exit the room (post-exam buffer). Check out our glossary entry > Buffer time for more information.
The current available options in Display > Buffer time are:

Note: an upcoming release will allow you to define more complex buffer times including times depending on patient class and asymmetric pre/post times.
How does buffer time affect the Calendar view?
Buffer time is added before and after each exam (while correctly compensating for potential overlap it could create). It will affect numerous metrics (that’s why the metrics refresh when you change the Buffer time setting).
Visually, it is represented with a lighter green color (see below). Based on your selection, the dimensions will vary as illustrated below.
5mn pre+post exam |
|
20mn pre+post exam |
|


Changing buffer time will also update the information displayed when you hover over an exam such as Exam duration.
Metrics

On the right end of the screen, you can find a set of metrics. Select one to display the data in the Calendar
Metrics update based on your filters, including your buffer choices.
Metric | Definition |
|---|---|
Accession count |
|
Average Exam Delay |
|
Average Exam Duration |
|
Average Gap |
|
Count |
|
Day End Gap |
|
Day Start Delay |
|
Slot utilization |
|
Utilization |
|
.png)
.png)
Note : you can also hide the metrics by selecting ‘No metrics’ in the Display settings
Using filters
Selecting Scanners
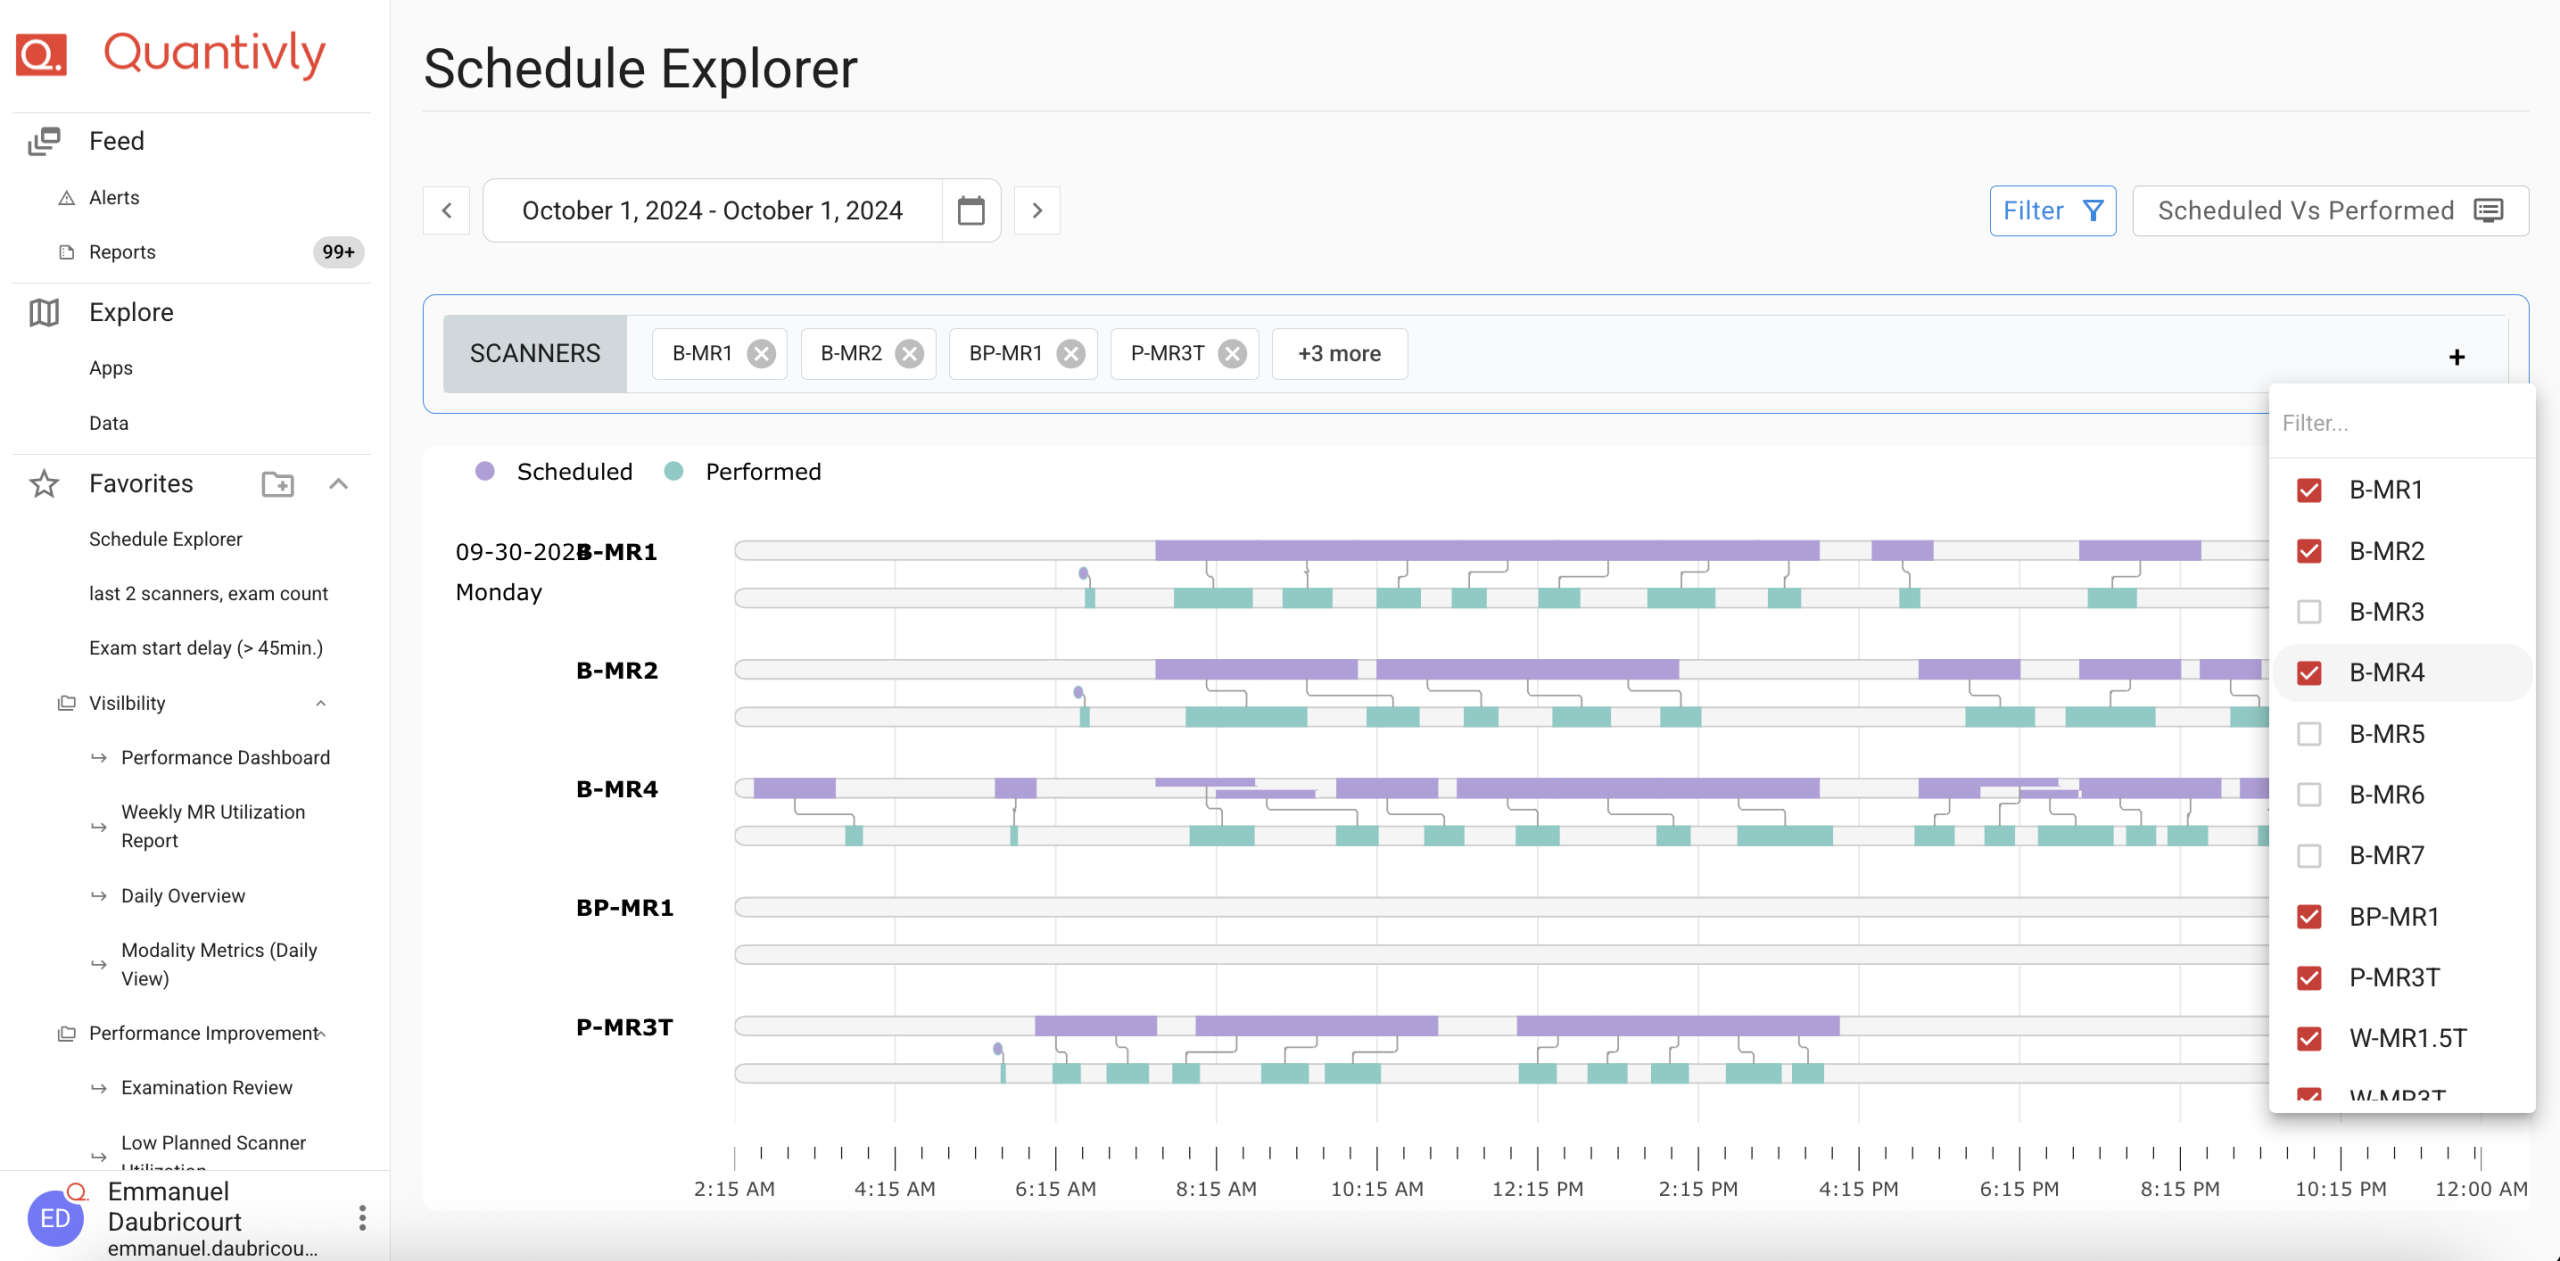
You can customize which scanners you wish to see by clicking the 'Filter' button.

You can remove scanners by clicking the  button by or click the '+' button to access the list of devices and select/unselect the scanners that you need.
Applying time filters
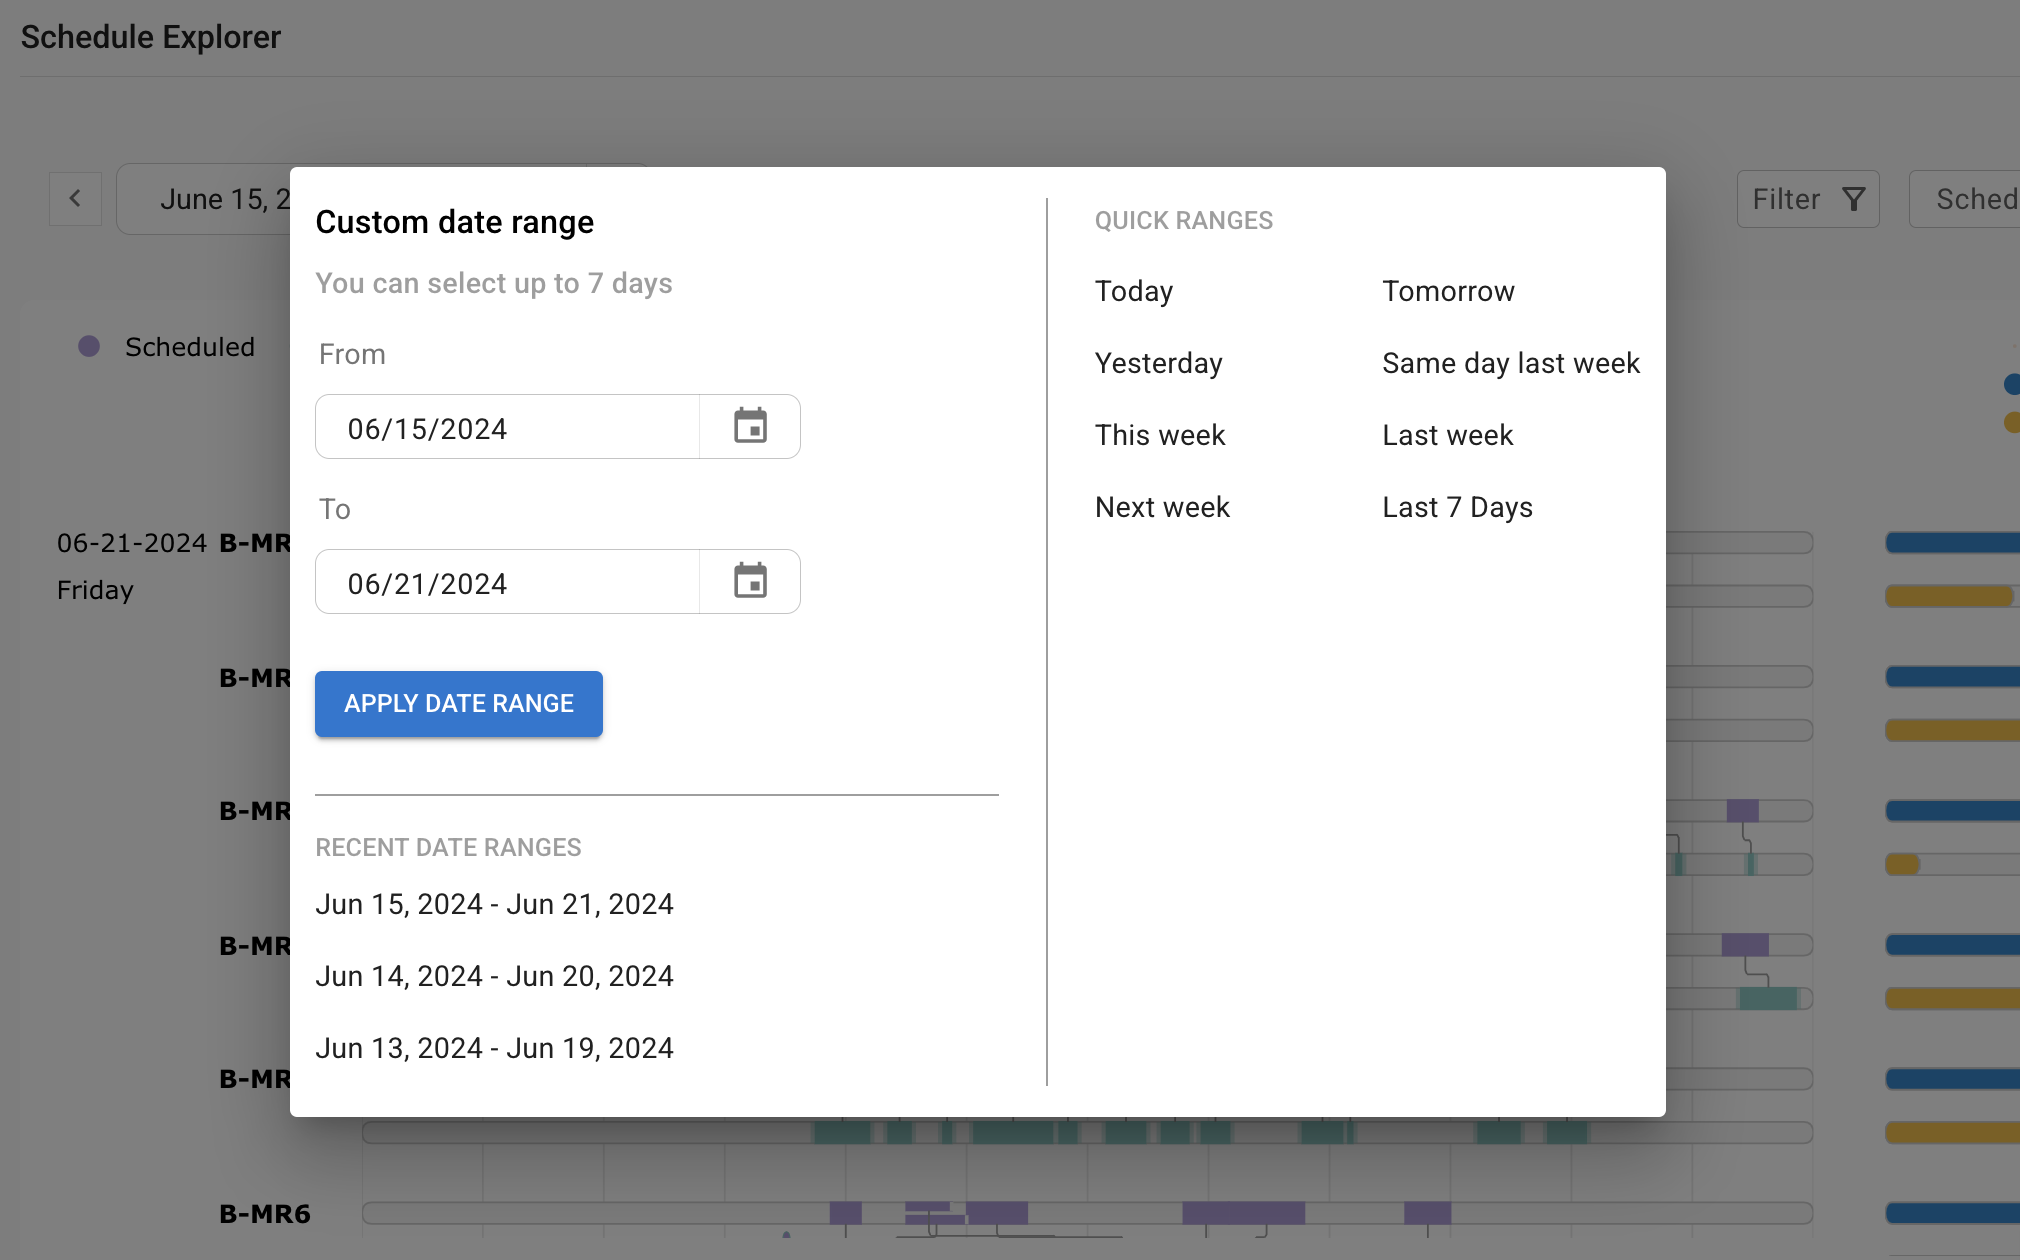
The Calendar can show a maximum of seven days of data.
You can select your date range by clicking on the date picker button at the top. You can also move your time interval up or down one day by clicking on the arrows

Tip: you can find quick ranges in this modal to save time. You can also find your most recent date selection at the bottom left.
Drilling down
Quick view with the hover details
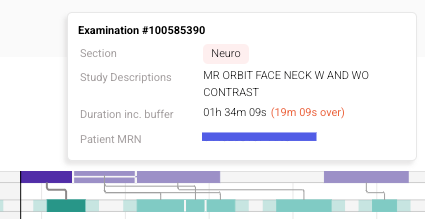
You can show a few selected details by hovering over any appointment or exam. You will see a pop-up as shown below:

Need to copy-paste some of the information? When viewing the details, click on this button to copy the field that you need.

Opening the side panel
To get more information on an exam, simply click on a tile : a side panel will open, containing additional fields.
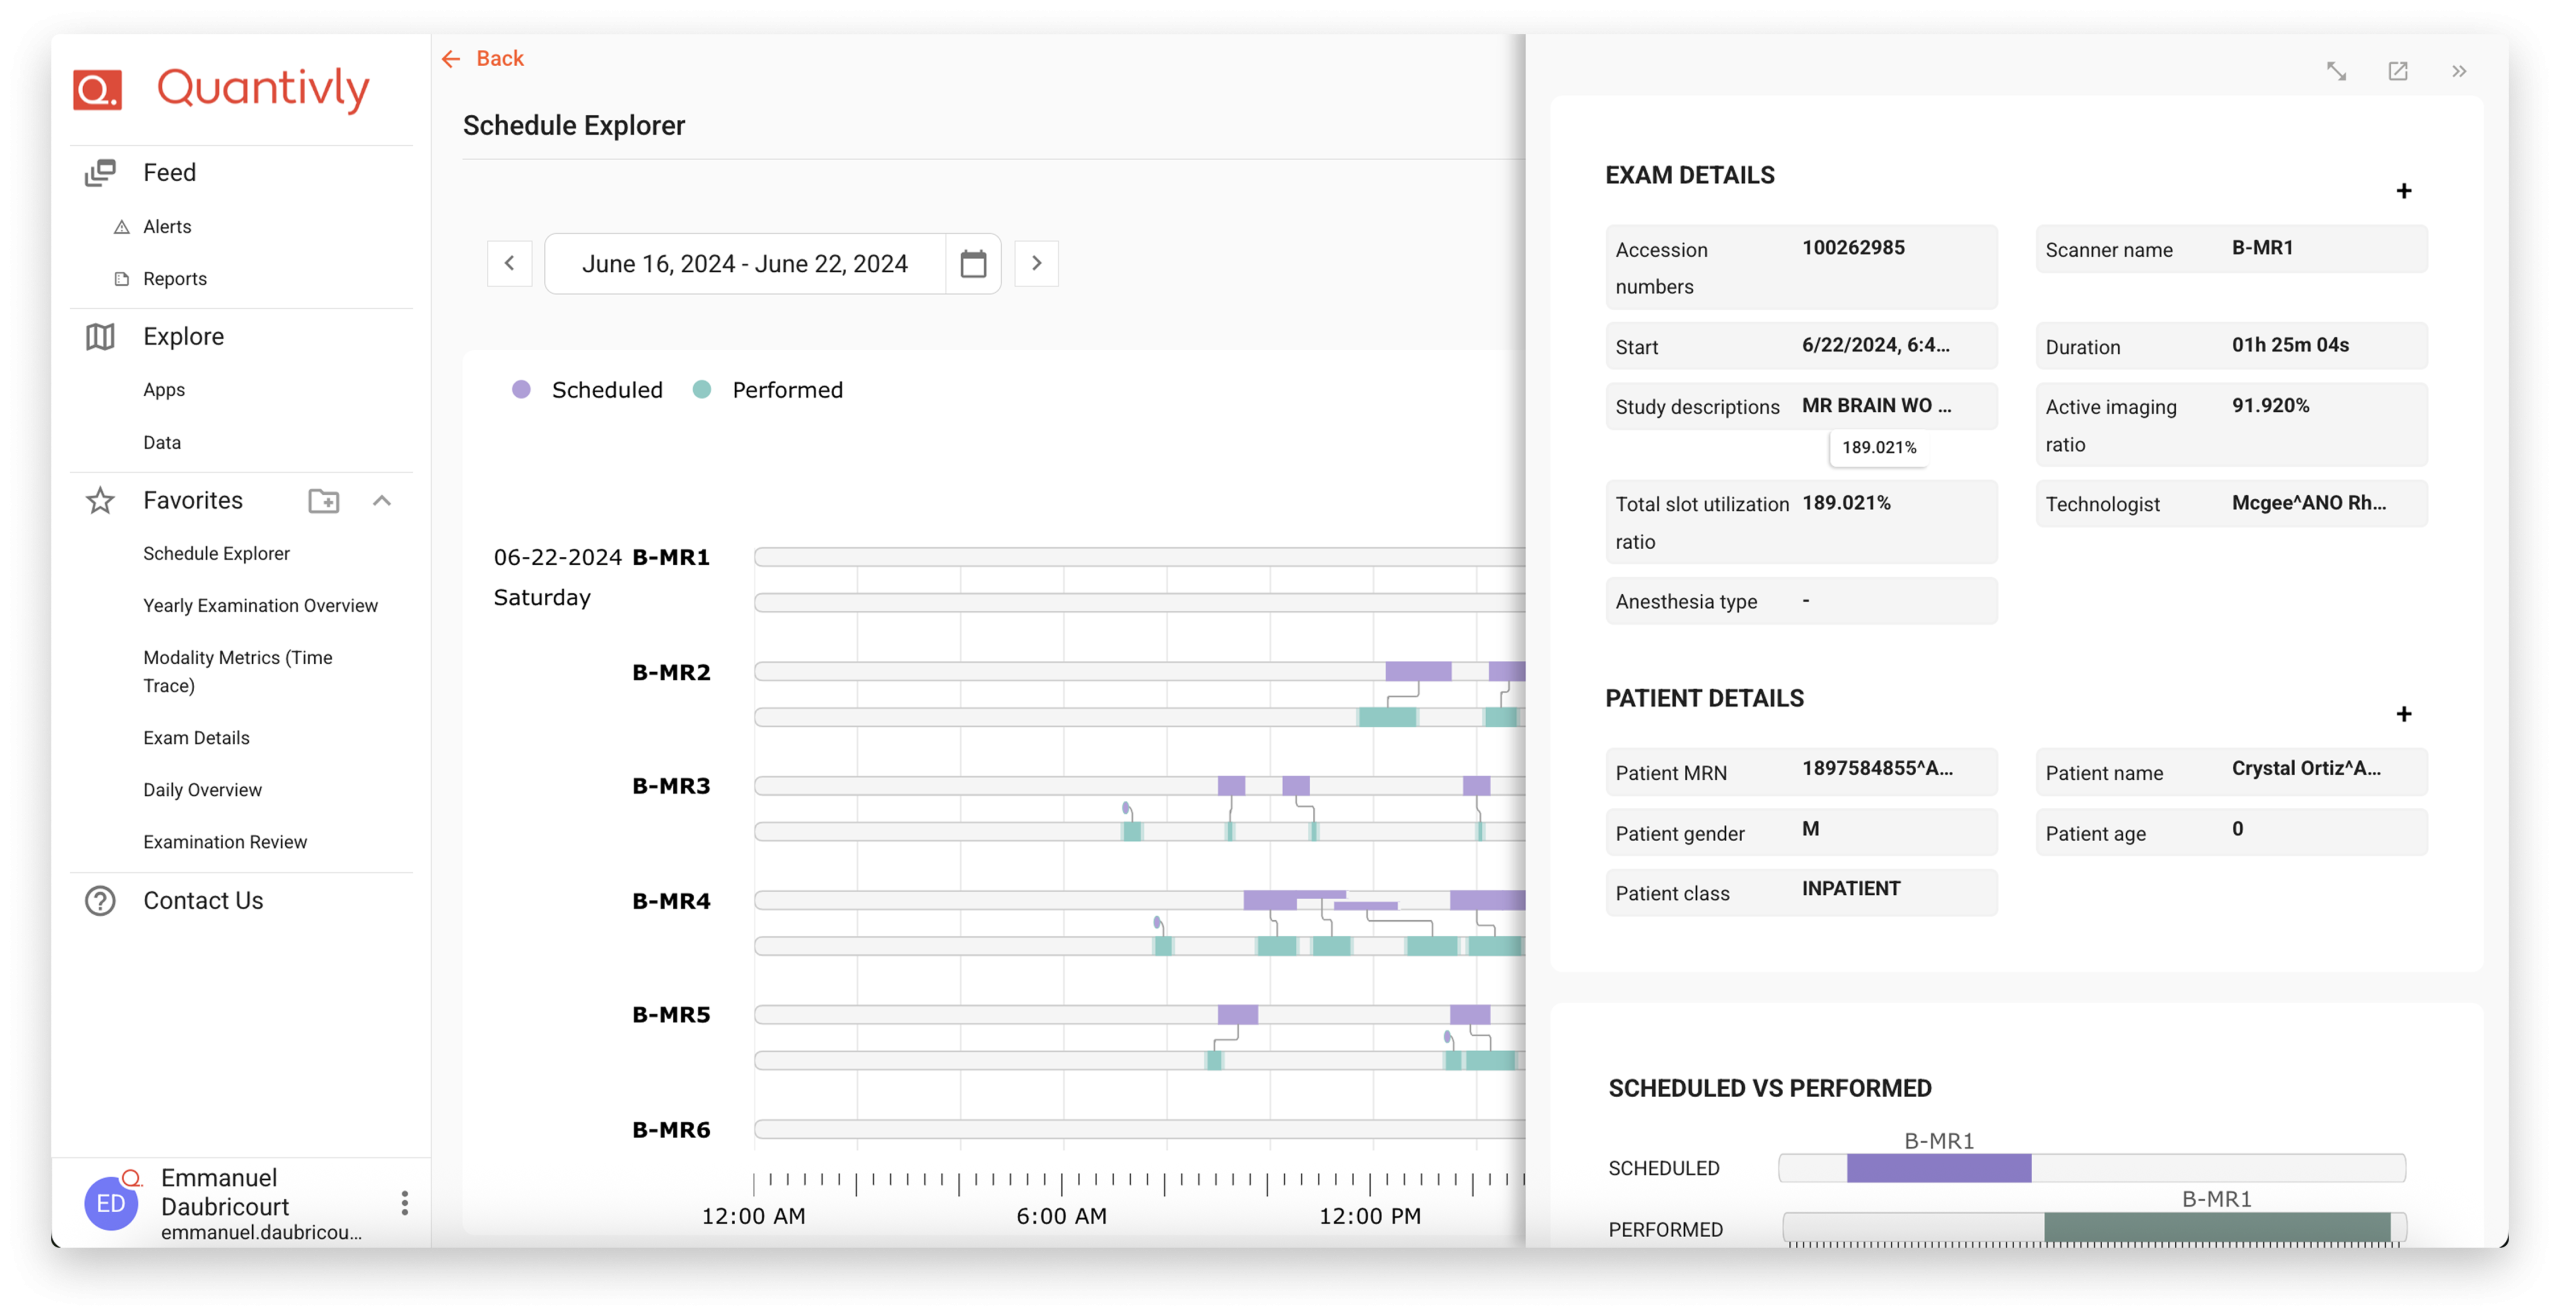
You can also open these details in a new tab or view in full page, using the top bar in the side panel.
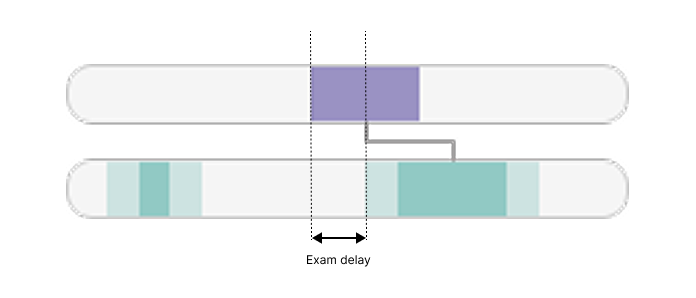
Gap hovering
In the calendar, you are able to highlight white space by hovering over gaps and see more information on them in a panel
Gaps are limited to Operating Hours
The rectangle will show the time between consecutive appointments or exams. In the case of exams, it will show the time between the exam end time of exam N-1 (not taking post-exam Buffer time into account) and the exam start time of exam N (not taking pre-exam Buffer time into account)
Note: when looking at an inter-exam gap, the panel will show duration including buffer. We are planning on harmonizing this user experience in an upcoming release of the Quantivly Hub.
Help us improve
Would you like to share feedback on this feature? We would love to hear your thoughts on what you have found useful - or what could be added, so we can further improve this functionality.
To do so, please contact contact-cx@quantivly.com
