About this feature
It allows you to download files from any Grafana dashboard on the Quantivly Hub, so you can use them for further analysis or integrate in other documents/presentations.
Before you start
Requirements :
Platform requirements: all versions.
SRE requirement: none
Availability : general availability
Getting started
Dashboards
Below is a list of the most popular Grafana dashboards on Quantivly :
Daily Overview
Modality Metrics
Technologists Insights
Overview by Section
Compare Studies
You can find more dashboards in Explore > Apps > Grafana Dashboards
Note : Additional dashboards may be available. Please contact our Customer Experience team for more information.
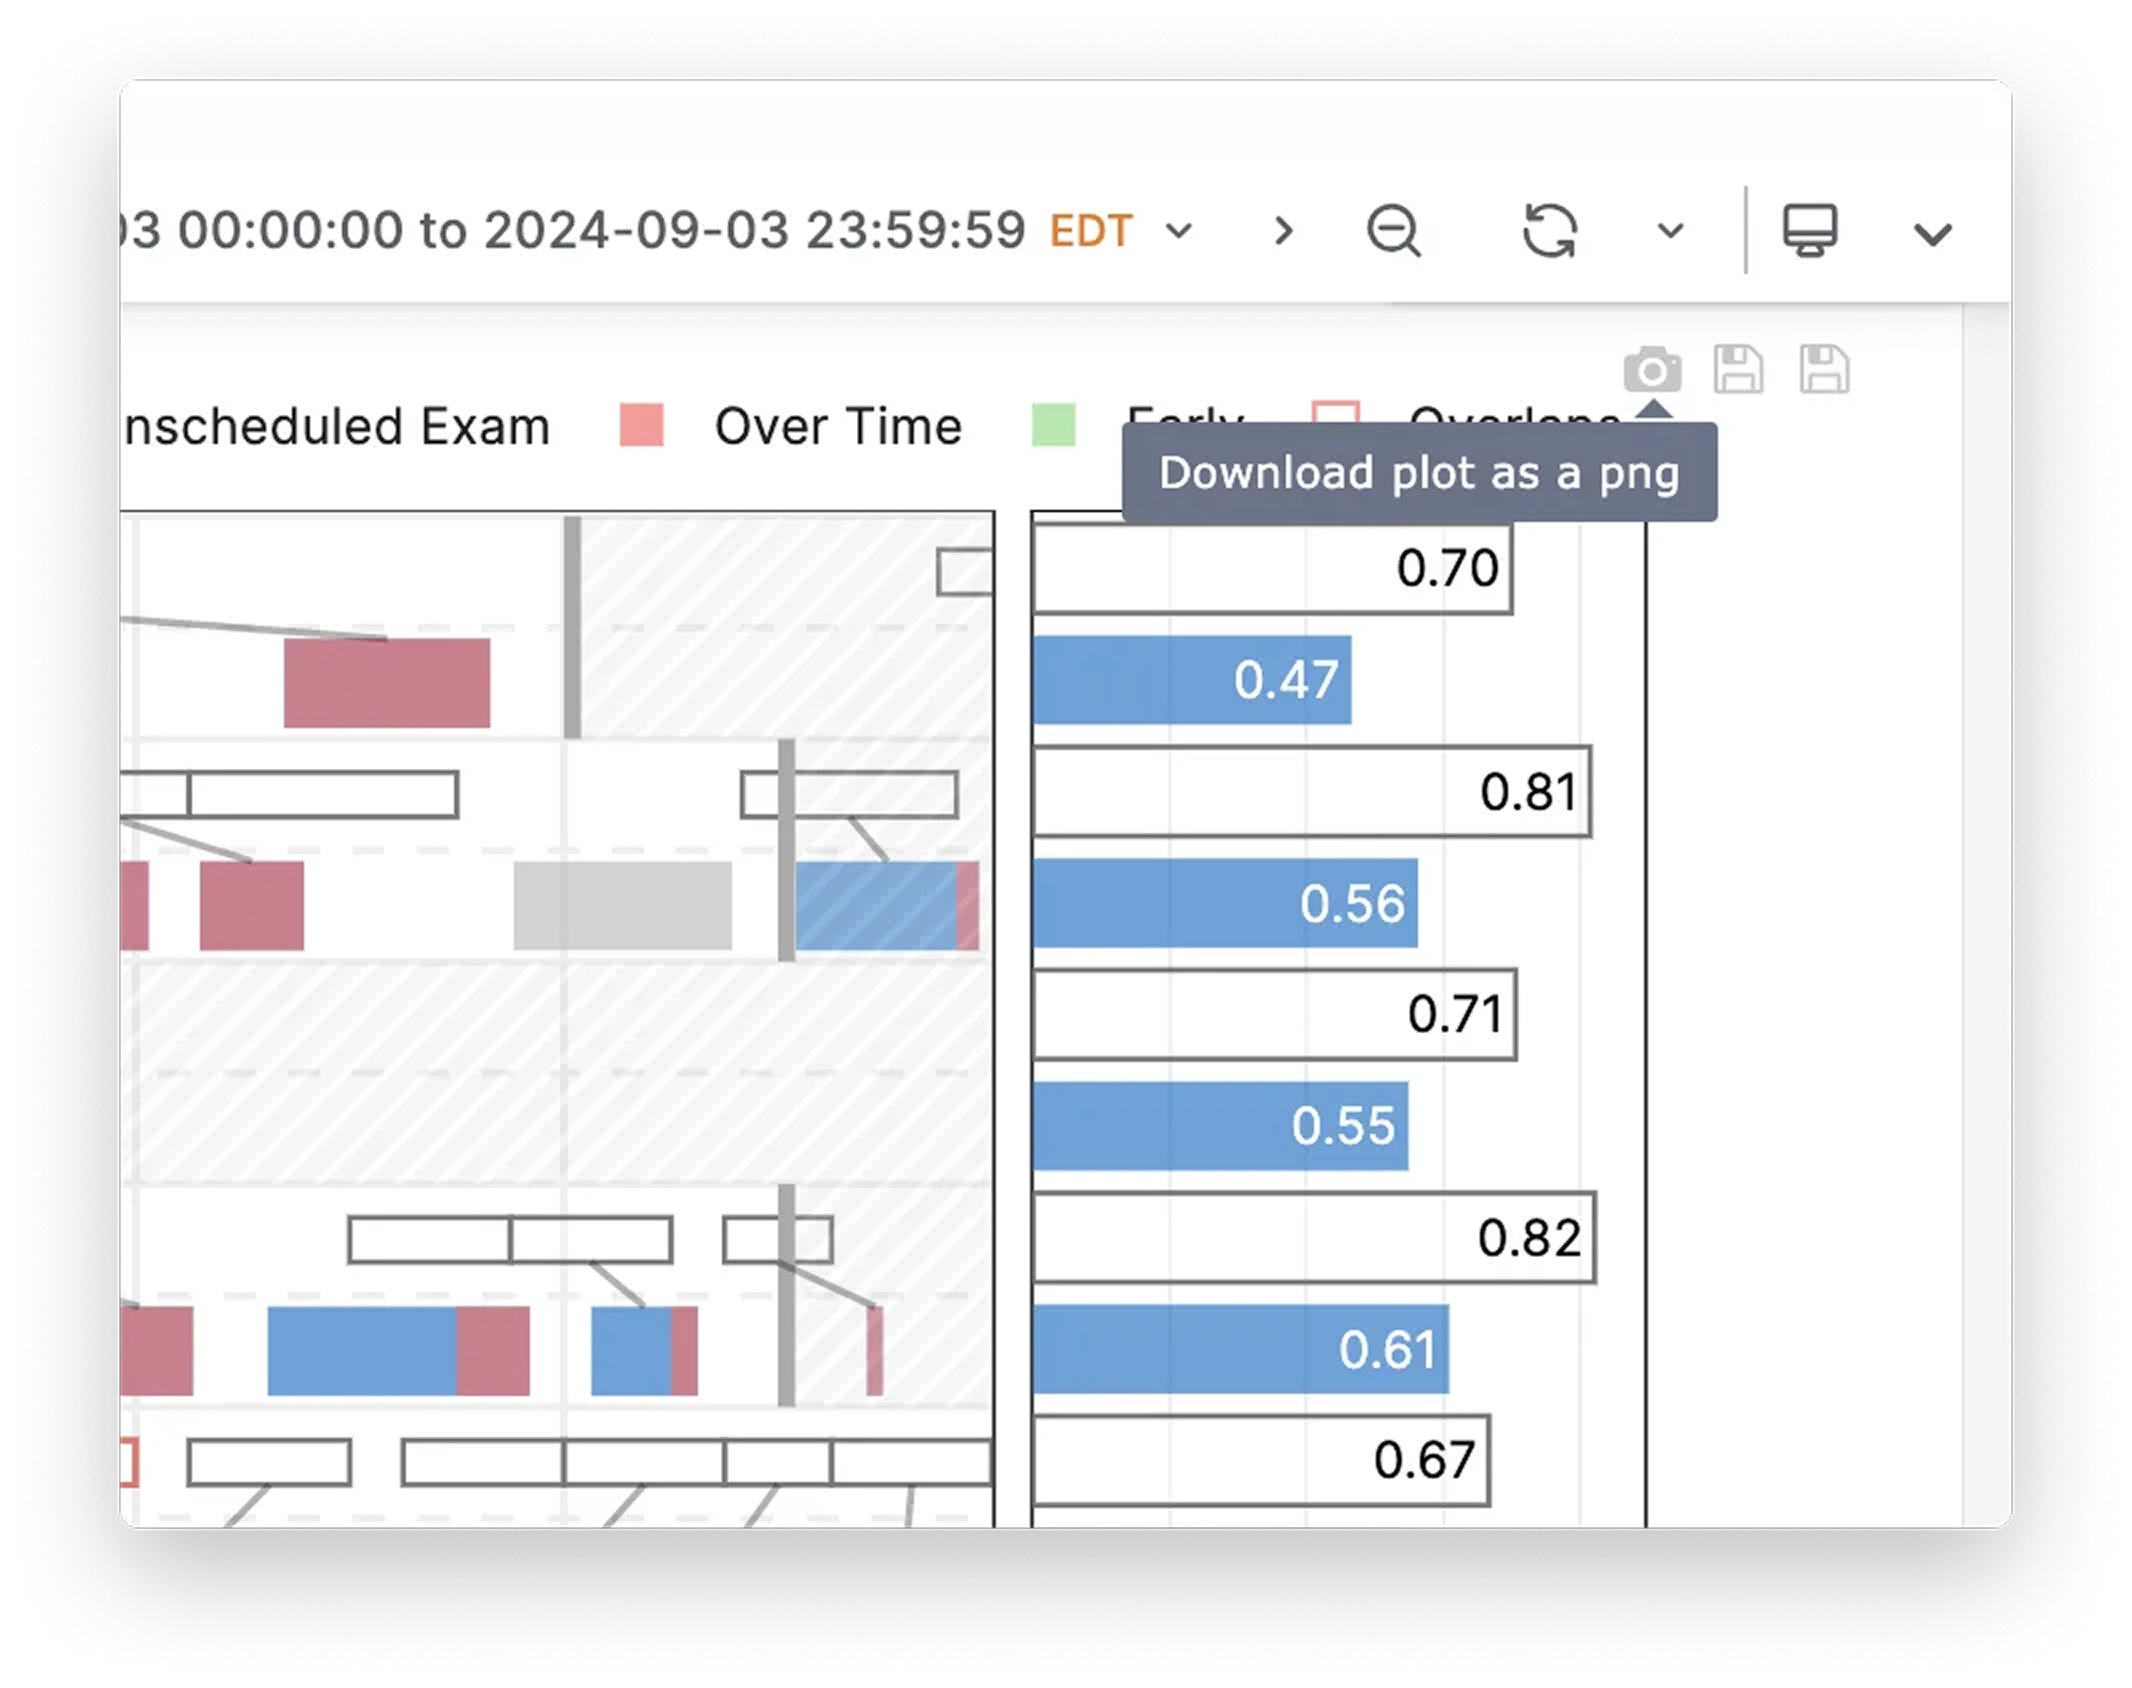
Exporting charts
Charts (also called ‘plots’) can be exported as image files (.png). Simply use the button located on the plot, as shown below.
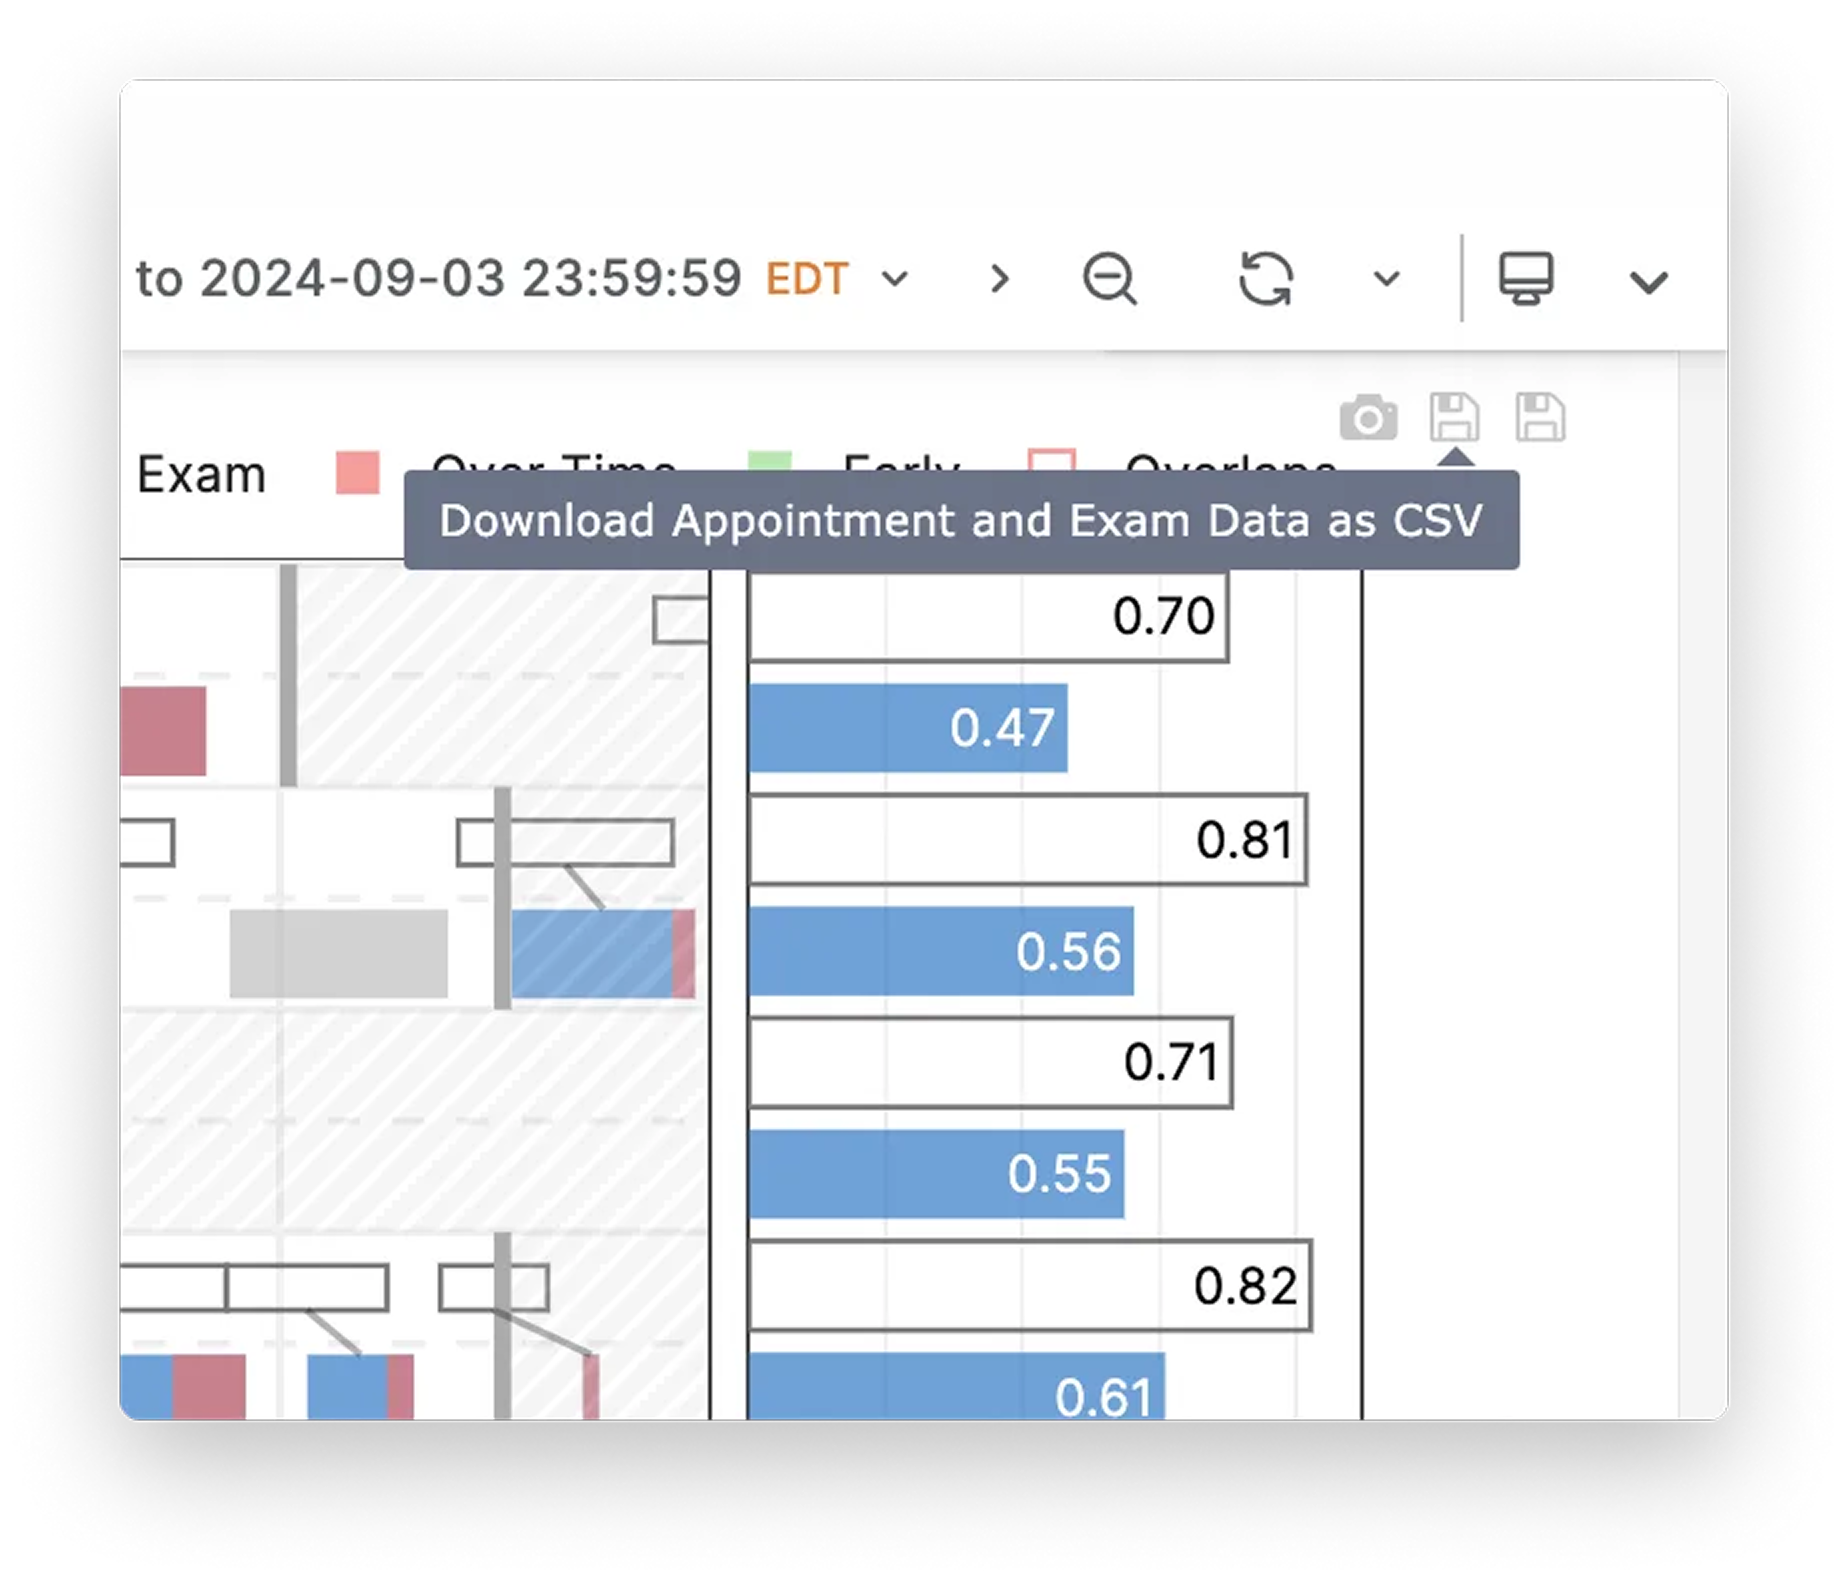
Tabular data from plots
The tabular data corresponding to each chart can be exported as a .csv file.
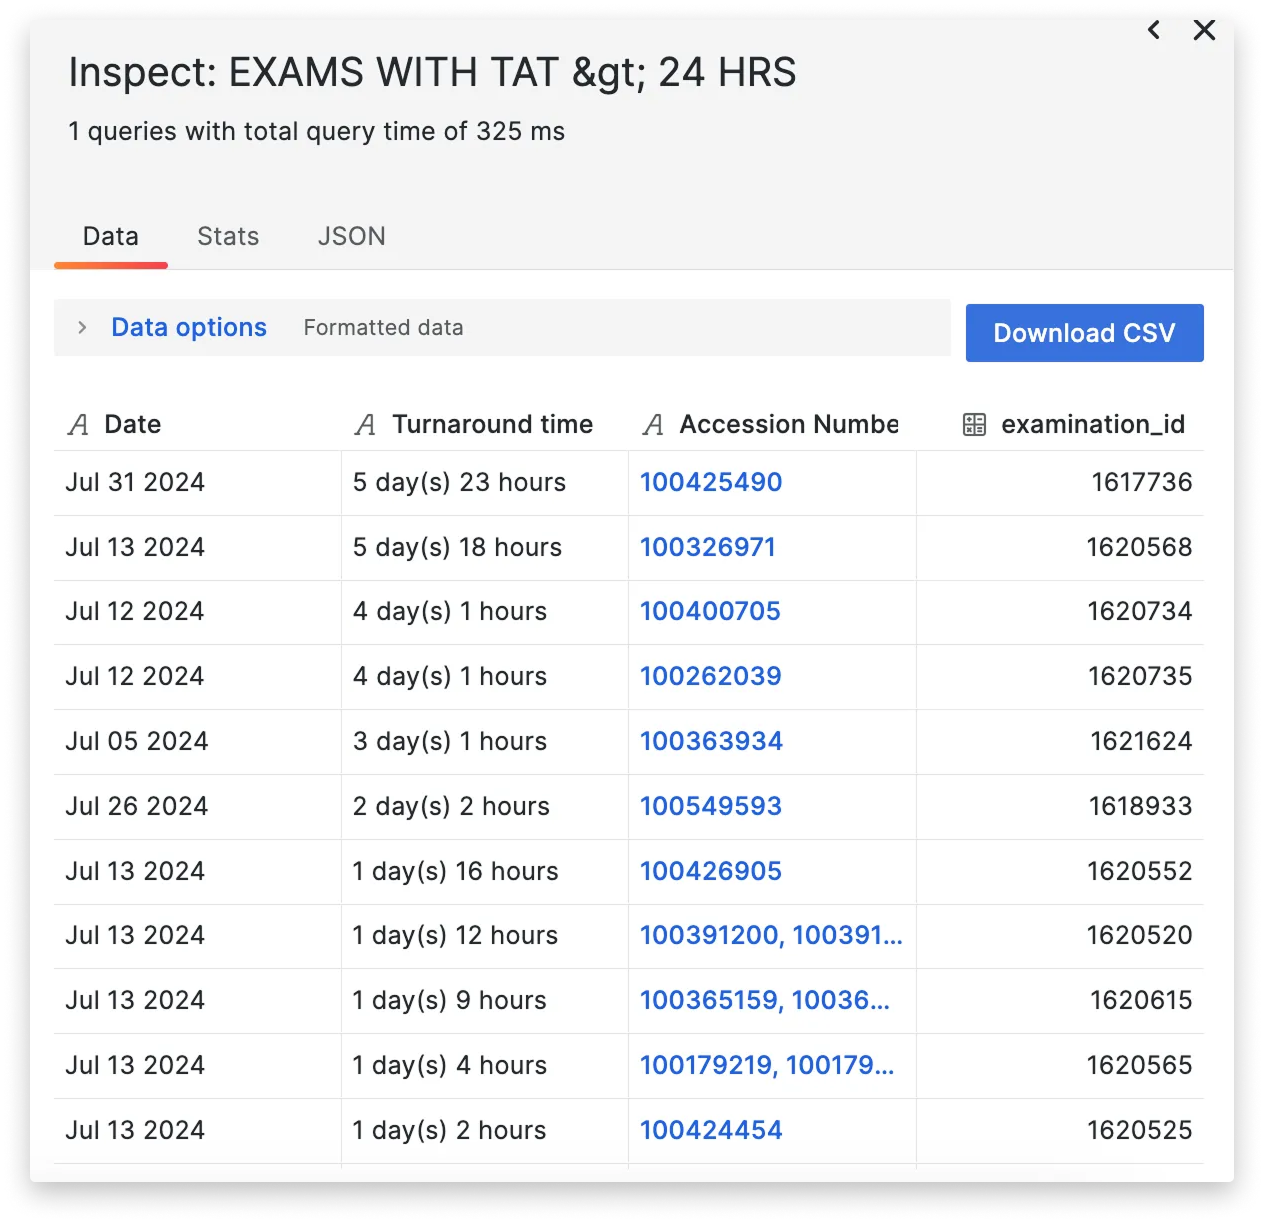
Data tables
Data in tables can be exported as a .csv or .json file by clicking on the ‘…’ at the top-right corner of any data table.
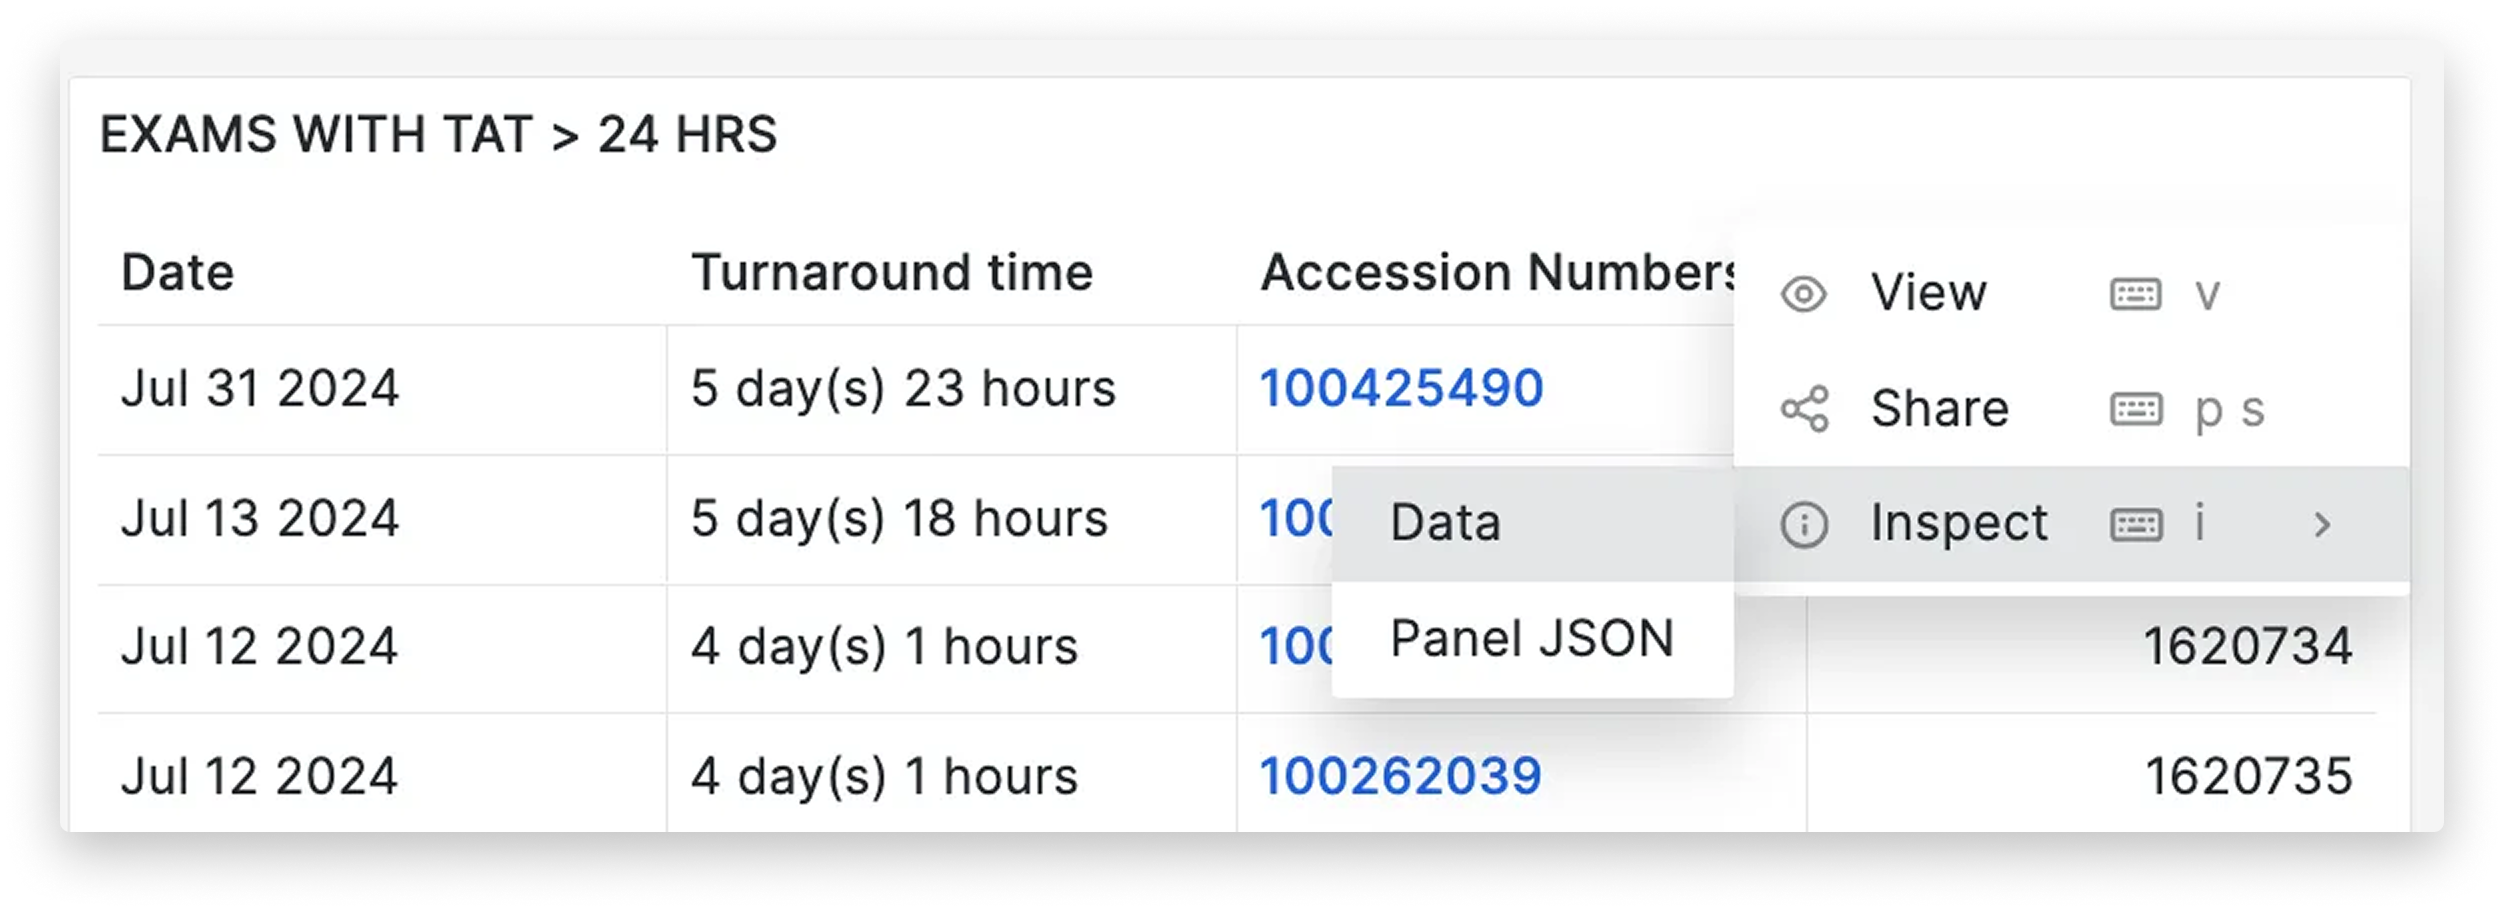
You will be able to find a data panel with a blue button labeled ‘Inspect’, which opens detailed data behind the chart.