Inspect the timeline of your imaging operations, scanner by scanner, to compare what was scheduled vs what happened.
We welcome your feedback to improve it and make it more useful to you. Please see below to reach out and chat with us.
Note : the Calendar was formerly accessible as the Schedule Explorer
Getting started
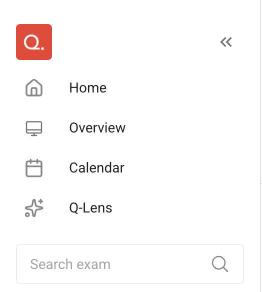
The Calendar is directly accessible from the side navigation menu.
Understanding the data
The Calendar is a visualization of how long your imaging operations unfolded throughout the day. It combines DICOM and HL7 data into a harmonized view.
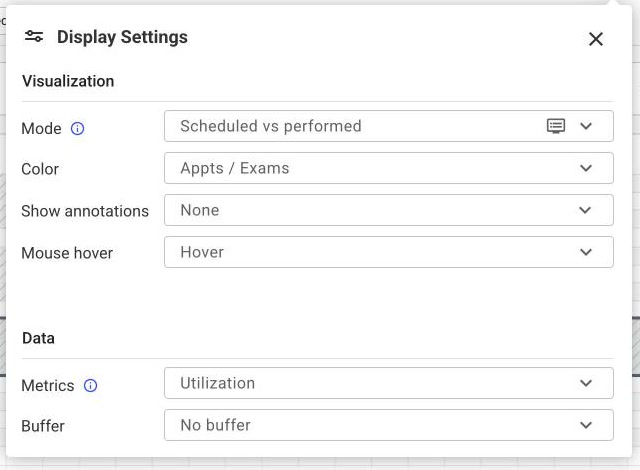
From the ‘Display’ button, you can select different modes.
Visualization modes
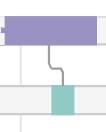
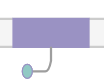
‘Scheduled vs performed’ Mode | This is the default mode when schedule (HL7) data is available (otherwise the Calendar defaults to Performed): it shows a comparison of appointments (what was scheduled) and exams (what was performed), for each scanner and each day within your selection. In this mode, you will be able to visualize links between appointments and exams that are linked.
Note that a Buffer time is added to 'performed' tiles, to account for patient change time. |
‘Scheduled from performed’ Mode | This mode shows the same rows as ‘Scheduled vs performed’, but moves each appointment to the scanner its linked exam actually ran on, rather than the one it was booked on. Per-scanner metrics then reflect where the work actually happened. |
‘Scheduled’ Mode | In this mode, only appointments are displayed. |
‘Performed’ Mode | In this mode, only exams are displayed. Note that a Buffer time is added. ‘Scheduled vs performed’, ‘Scheduled from performed’ and ‘Scheduled’ require integration with HL7 to be displayed. |
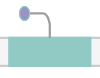
Operating Hours
Operating Hours are shown as grey shapes with hatch line fill and black borders, indicating when the scanner is closed (see Understanding Operating Hours). They are taken into consideration in calculation of numerous metrics - please keep reading for more details and don’t forget to take a look at our glossary.
Buffer time & How it affects the Calendar
About buffer time
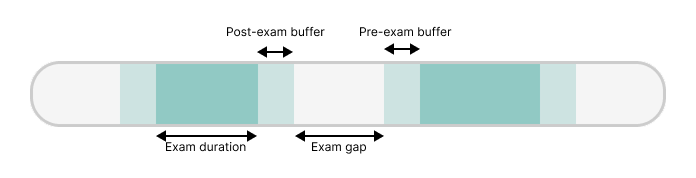
Buffer time allows you to model the time spent preparing the scanner for patients (pre-exam buffer) and the time it takes for patients to exit the room (post-exam buffer). Check out our glossary entry > Buffer time for more information.
The current available options in Display > Data > Buffer are:
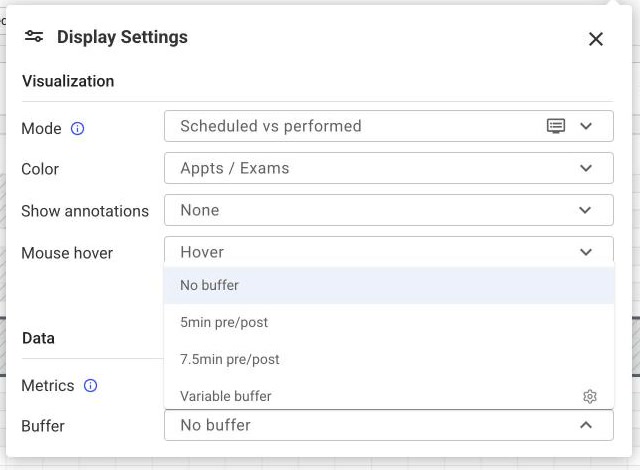
For asymmetric or rule-based buffers (by patient class, age, contrast, or sedation), click the gear icon next to the Variable buffer option. See the Buffer time article for details.
How does buffer time affect the Calendar view?
Buffer time is added before and after each exam (while correctly compensating for potential overlap it could create). It will affect numerous metrics (that’s why the metrics refresh when you change the Buffer time setting).
Based on your selection, the dimensions will vary as illustrated below.
5mn pre+post exam |
|
7.5min pre+post exam |
|


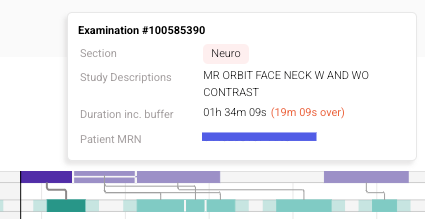
Changing buffer time will also update the information displayed when you hover over an exam such as Exam duration.
Metrics
.png)
Choose a metric in Display > Data > Metrics. Its values are shown in the column at the right end of the Calendar, with a legend naming what each bar represents.
Metrics update based on your filters, including your buffer choices.
Metric | Definition |
|---|---|
Accession Count |
|
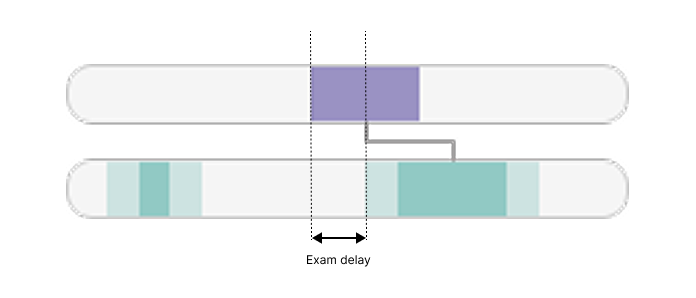
Average Exam Delay |
|
Average Duration |
|
Average Gap |
|
Count |
|
Day End Gap |
|
Day Start Delay |
|
Overbooking |
|
Slot utilization |
|
Utilization |
|
.png)
.png)
Note : you can also hide the metrics by selecting ‘No Metrics’ in Display > Data > Metrics
Using filters
Selecting Scanners
You can customize which scanners you wish to see by clicking the 'Filter' button and selecting Scanners. You will then have the option to group by Facility, Vendor, Care setting, Magnetic strength, or No grouping, to search, and to hide decommissioned scanners with the ‘Hide decommissioned’ toggle..png)
.png)
You can remove scanners by clicking the ‘x’ button, or clicking the filter chip to edit your selection. The '+' button will allow you to add additional filtering (ie Weekday)
.png)
Applying time filters
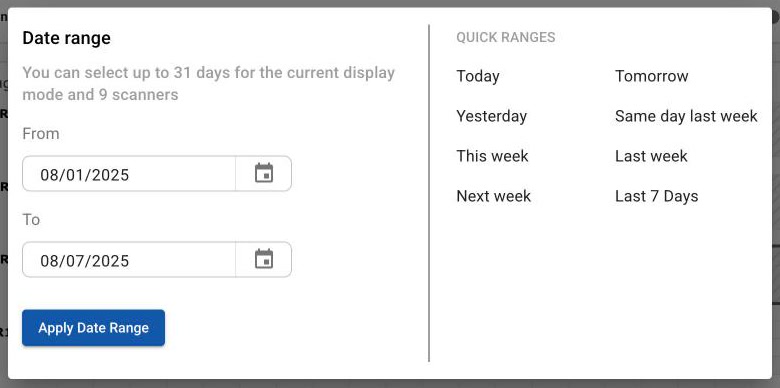
The Calendar renders a limited number of rows rather than a fixed number of days (up to 560 rows: days × scanners, doubled in ‘Scheduled vs performed’ and ‘Scheduled from performed’). Wider selections show fewer days; for example, 10 scanners in ‘Scheduled vs performed’ allow up to 28 days. The date picker shows the limit for your current selection, for example “You can select up to 35 days for the current display mode and 8 scanners”.
You can select your date range by clicking on the date picker button at the top. You can also move your time interval up or down one day by clicking on the arrows
.png)
Tip: you can find quick ranges in this modal to save time. You can also find your most recent date selection at the bottom left.
Drilling down
Quick view with the hover details
You can show a few selected details by hovering over any appointment or exam. You will see a pop-up with those details.
Need to copy-paste some of the information? When viewing the details, click the copy button next to a field to copy it.
Opening the side panel
To get more information on an exam, simply click on a tile : a side panel will open, containing additional fields.
You can also open these details in a new tab or view in full page, using the top bar in the side panel.
Gap hovering
In the calendar, you are able to highlight white space by hovering over gaps and see more information on them in a panel.png)
Gaps are limited to Operating Hours
The rectangle will show the time between consecutive appointments or exams. In the case of exams, it will show the time between the exam end time of exam N-1 (not taking post-exam Buffer time into account) and the exam start time of exam N (not taking pre-exam Buffer time into account)
Clicking an exam gap will open a dropdown that will allow you to quickly add an Exception or Event, or Reserved Block.
Note: when looking at an inter-exam gap, the panel will show duration including buffer.
Adding annotations to the Calendar
There are a few ways to add an annotation while you’re on the Calendar:
Click and drag to create
Click and drag across a scanner’s row to select a time range, then release to open the create dialog and choose the annotation type. .png)
Using gap hover
Hover over a gap to highlight it, then fill the whole gap with an annotation in one step — a quick way to annotate a specific block of empty time.
Using the Add annotations button
Click Add annotation in the toolbar to open the create dialog directly.
.png)
You can add and manage annotations from the Annotations page (Explore > Annotations), you can also add occurrences of the annotations to the calendar directly from there — see Annotations settings.
Adding exceptions requires the Change operating hours and exceptions capability, and adding reserved blocks or events requires the Schedule reserved blocks and events capability. Without them, the Calendar shows a view-only banner explaining what you cannot change. The Add annotation button is also unavailable while another user is editing the calendar; hover over it to see who.
Customizing the display
You can tailor how the Calendar looks and what it shows: assign colors to tiles with Color coding, and choose which fields appear when you hover with Custom hover. To choose which day the Calendar opens on, or your default color strategy, see Calendar defaults.
Sharing a Calendar view
You can share the exact view you are looking at with another Quantivly user by copying a link to it.
In the Calendar header (next to Favorite and Views), click the Copy to clipboard button (the share/link icon). The link is copied and a URL copied to clipboard! confirmation appears. Paste it into an email, a message, or a saved note to share it.
Opening the link recreates your current view for the other person: the date range, display mode, metric, buffer setting, color coding, modality and scanner selections, weekday filter, and annotation-label selections, along with your zoom level and scroll position. If you have an exam’s details panel open, it reopens too.
The link also includes the Custom hover fields you have on screen, so the recipient sees the same hover details. A highlighted gap selection is not included in the link. If the recipient does not have access to a scanner, modality, or exam referenced in the link, those parts will not load for them.
Help us improve
Would you like to share feedback on this feature? We would love to hear your thoughts on what you have found useful - or what could be added, so we can further improve this functionality.
To do so, please contact contact-cx@quantivly.com
